Thanet Property Market: Navigating Six Years of Ups and Downs Amid Interest Rate Shocks and Pandemic Surges!
The Thanet Property Market: A Rollercoaster Ride
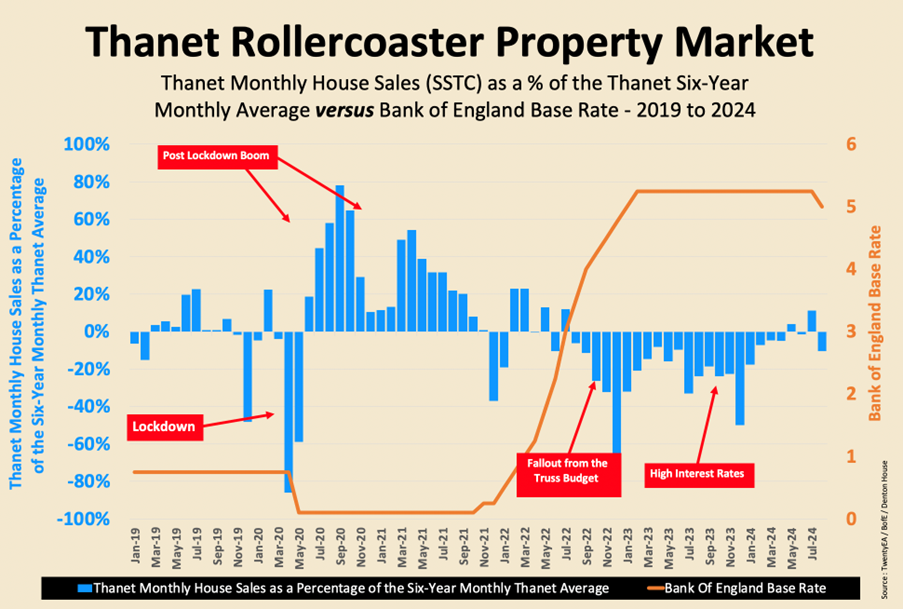
The Thanet property market has experienced a rollercoaster ride since 2019, reflecting the unprecedented challenges and opportunities that have shaped the landscape of home buying and selling in the area. The accompanying graph vividly illustrates these dramatic fluctuations, comparing Thanet's monthly house sales, expressed as a percentage of the six-year (2019 to 2024) average in blue. Also on the graph in orange is the Bank of England's base rate between 2019 to 2024.
By examining this six-year time frame, we can better understand the resilience of the local market and the influence of economic factors, particularly interest rates, on property transactions.
The Pandemic’s Impact and Post-Lockdown Surge
The first significant event highlighted in the graph is the pandemic and the lockdown in early 2020. The property market in Thanet, like much of the country, ground to a near halt, with house sales in April 2020 alone plummeting by 86% below the 2019 to 2024 medium-term six-year monthly average. The lockdown effectively froze the Thanet property market, as restrictions made it difficult for people to view properties, secure mortgages, or move homes.
The Post-Lockdown Boom
However, the Thanet property market experienced a remarkable rebound once the lockdown measures were eased. The graph indicates a "Post Lockdown Boom," with sales soaring in some months to 78% above the six-year monthly average by mid/late 2020. This surge can be attributed to pent-up demand, government incentives like the Stamp Duty holiday, and a renewed appreciation for home ownership as people sought more space and comfort during uncertain times. This period saw extraordinary activity, with many homes selling quickly and often above the asking price.
The Truss Budget and Rising Interest Rates
The Thanet property market remained buoyant through 2021, although sales began to normalise in the later months of that year, fluctuating but still frequently staying above the long-term average. The shift in dynamics started in mid/late 2022, coinciding with the economic upheaval triggered by the "Truss Budget." The budget, which led to market instability and rising mortgage rates, immediately impacted buyer confidence. As a result, Thanet's house sales dipped below the long-term average as potential buyers paused to reassess their financial positions.

Resilience and Recovery in 2024
Despite the headwinds of higher interest rates, the Thanet property market in 2024 shows signs of resilience. The graph illustrates that even with these challenges, monthly sales have stabilised and are only just below the long-term average, a testament to the underlying strength of the local market. It's important to note that this average includes the exceptionally high sales volumes of 2020 and 2021, making the current performance even more impressive.
In-Depth Annual Data for Thanet
Looking at the data for Thanet estate agents in the postcodes CT7 to CT12:
- 2019 - An average of 276 properties sold (stc) per month in Thanet, 0.8% lower than the long-term 6-year monthly Thanet average of 278 property sales.
- 2020 - An average of 318 properties sold (stc) per month in Thanet, 14.3% higher than the long-term 6-year monthly Thanet average of 278 property sales.
- 2021 - An average of 335 properties sold (stc) per month in Thanet, 20.3% higher than the long-term 6-year monthly Thanet average of 278 property sales.
- 2022 - An average of 255 properties sold (stc) per month in Thanet, 8.5% lower than the long-term 6-year monthly Thanet average of 278 property sales.
- 2023 - An average of 215 properties sold (stc) per month in Thanet, 22.8% lower than the long-term 6-year monthly Thanet average of 278 property sales.
- 2024 YTD - An average of 267 properties sold (stc) per month in Thanet, 3.9% lower than the long-term 6-year monthly Thanet average of 278 property sales.
Looking Ahead: A Market of Opportunity
As we move deeper into 2024, the Thanet property market presents opportunities for buyers and sellers. For sellers, the current conditions indicate that, despite higher interest rates, there is still strong demand for well-priced properties. On the other hand, buyers may find that the stabilising market offers a window of opportunity to secure a home before any potential further economic changes.

Conclusion: Understanding the Market
The Thanet property market may have its ups and downs, but with careful planning and the right guidance, there are still plenty of opportunities to capitalise on this ever-changing landscape. If you're considering moving in the next 6 to 12 months, now might be the perfect time to explore your options. Reach out for a free, no-obligation valuation and market appraisal of your Thanet home, and let's discuss how I can assist you in navigating this dynamic market to achieve your property goals.

Please Click Here to visit our blog, property insights, and more.
We welcome your comments or suggestions for future articles.
About Cooke & Co
Cooke & Co has been providing estate agency services in Thanet since 1992, covering Margate, Broadstairs, Ramsgate, and surrounding areas.
Contact us:
- Margate Office: (01843) 231833
- Ramsgate Office: (01843) 851322
- Broadstairs Office: (01843) 600911
